


Three horizons of Growth
Making sense of McKinsey's Three Horizons of Growth with Tesla example
The Three Horizons of Growth model was originally promoted in the book The Alchemy of Growth. Written twenty odd years ago by Mehrdad Baghai, Steve Coley and David White.
Colloquially the model is called McKinsey’s Three Horizons Model or McKinsey’s Three Horizons of Growth. In majority, because the authors had ties to McKinsey & Company when they published the book – which is somewhat of a nice trivia.
The initial idea of the three horizons model was to create a roadmap for managers to achieve growth in the present and future. In the roadmap there are three pivotal points in which growth hinges on. Which, crudely summarized, would be to put three guiding north stars for the company, that are set apart by time.
Though the model has had its fair share of criticism in the twenty years consultants have used it, it is my opinion that it still holds a lot of value to managers, business owners, entrepreneurs, business developers, investors and the whole plethora of positions involved in creating value.
However, just like any well-known meme, the three horizons model has been tweaked to fulfill the goal of whomever is using or explaining it, until the point it is not clear anymore how the model is intended to be used.
You see, despite that the original authors explain the model quite clearly, the model, as a freestanding tool, is not as clear. Leaving interpretation of the model rather open-ended.

Moreover, if you do not dig in deep enough to understand the model – or purchase the book, which I recommend because it is written in an applicable way – a lot of the lines may get blurred, making it difficult to grasp what it stand-for and how to use it.
It is my intention to explain how the model was originally designed, and how the model applies to Tesla in this article.
In the next article, I will aim to explain it from a business development perspective and join the guilty bandwagon of misinterpreting the model. In the next article a model is presented that has been developed in the spirit of the Three Horizons of Growth.
If you are only interested in the original model, feel free to skip the adjacent article. The original model still works and still gets the job done.
The original McKinsey’s Three Horizons of Growth
Originally the model was developed to make growth opportunities visual for managers. The model is very similar to a portfoliomanagement framework, like the BCG matrix. Important was for managers or business leaders to be able to maintain their eyes on the ball, on all three different courts (Horizons), at the same time.
Growth opportunities are split into three different Horizons that are set apart by time. This is visually represented in a coordinate grid with two axes.
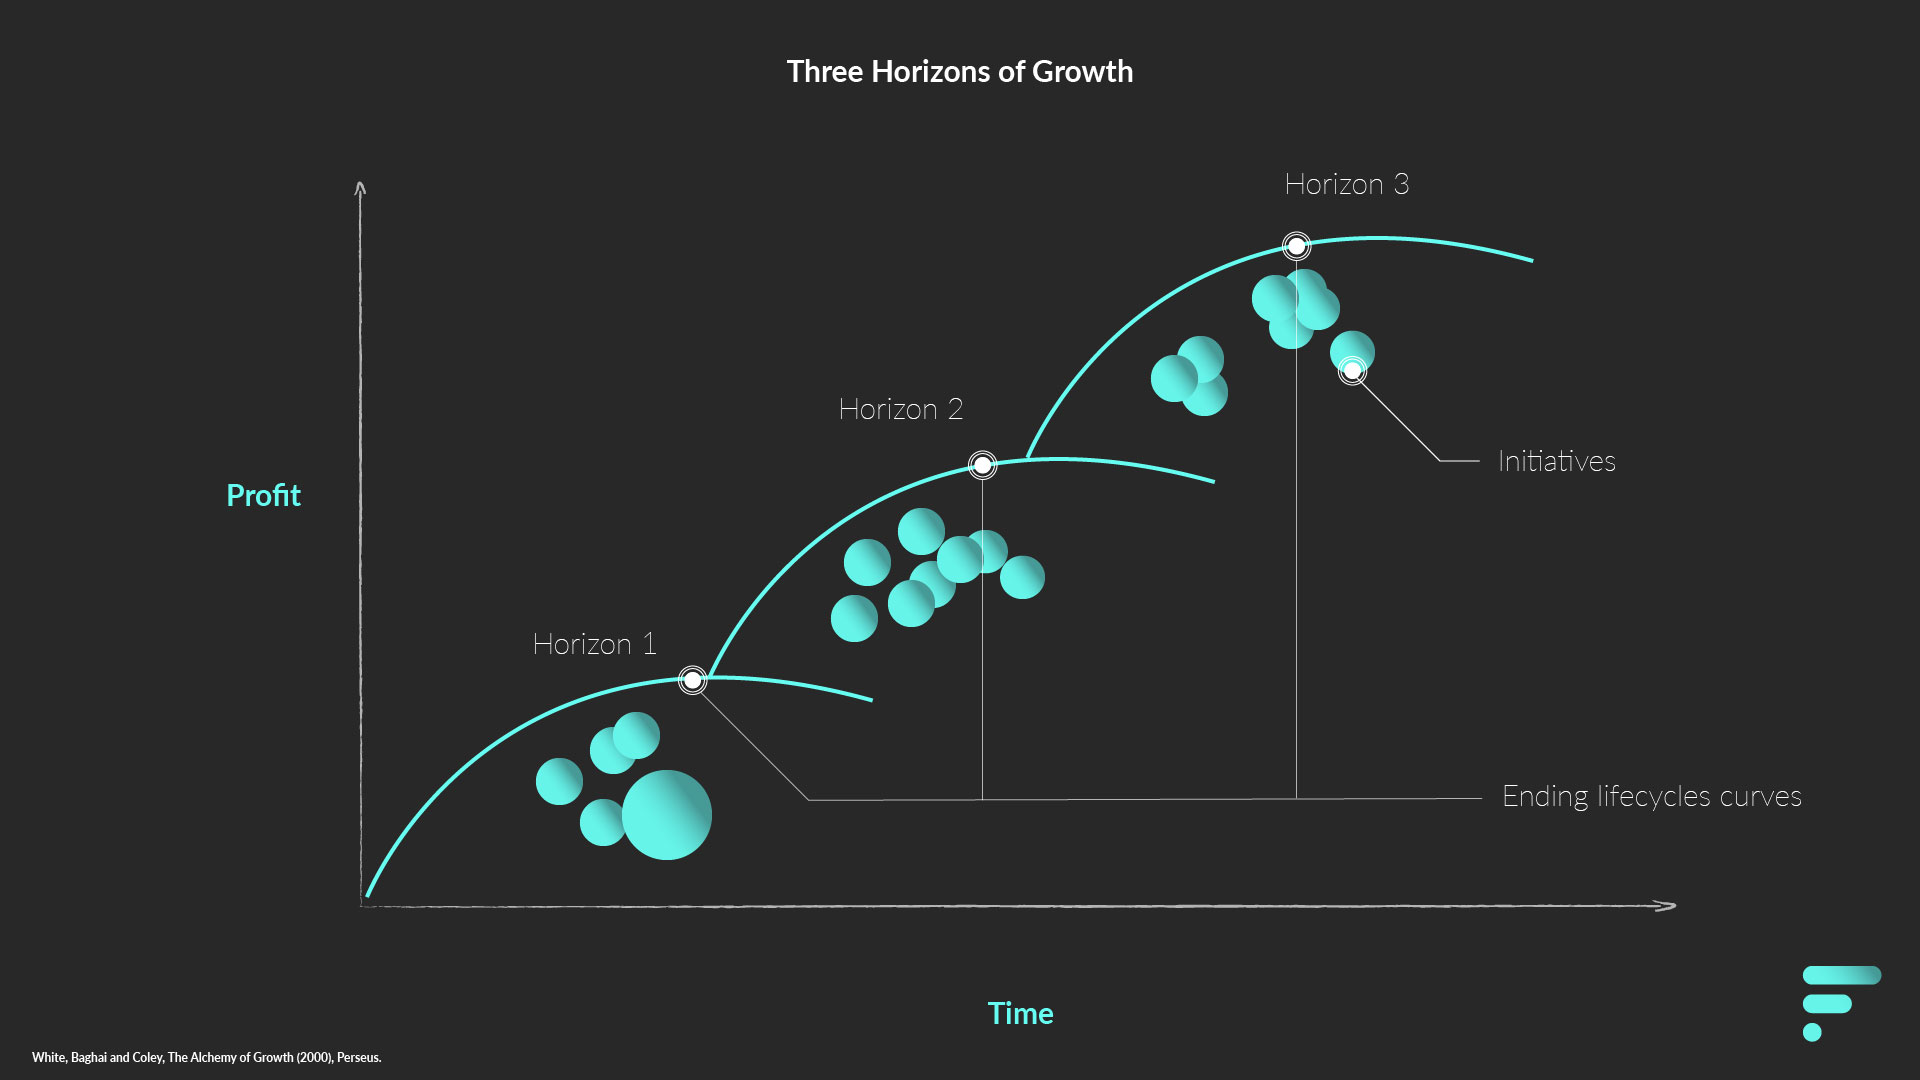
The X axis represents time and is split in three timeframes, which I will vaguely name, today, tomorrow and the day-after tomorrow – note that the X axis is the reason why, nowadays, the model is often disqualified. As business development, according to the authors, can take many years.
The Y axis represents profit (or value creation) and is the main way to measure growth. Though, keep in mind that “profit” should be a loose growth indicator. As Horizon 2 and, specially, Horizon 3 have not shown profit, let alone the ability to compound profits as time passes, as the model suggests.
In layman’s terms, the question the model is trying to answer is: what is making money now (Horizon 1), what will make money tomorrow (Horizon 2), and what will make money the day-after tomorrow (Horizon 3)?
One of the key take-aways from the model is that Horizon 1 businesses/products, will eventually decline and stall.
For that reason, there needs to be something else in the pipe-line to fill the void left by Horizon 1. Making investment from profits of Horizon 1 a necessity for a sustainable business.
Present: Horizon 1
The first horizon is perhaps the easiest to understand. They are the initiatives, products or SBUs that have the most impact on the business. The most sought-after products or services of the company. The bread and butter.
Measurement is in profit; the team is highly experienced and distribution is immaculate. Profits generated from Horizon 1, are generally used to fund projects on Horizon 2 and Horizon 3.
The focus for Horizon 1 is to maintain, defend and, if possible, grow.
It is crucial for Horizon 1, when it reaches a saturation point or end of the life cycle, to defend and maintain position (to create a competitive advantage for Horizon 2 and Horizon 3 project) and capture all possible value for as long as possible. As long as it is cost effective to do so.
Imagine it like an orange tree. Horizon 1 is a tree planted a couple of years ago, and is now giving plenty of oranges to make juice. When the orange tree is at the end of its cycle, the aim is to try to get every single droplet out of the oranges to make juice.
Eventually the orange tree will reach the end of the life-cycle, and the tree must be replaced by an already planted tree.
Which brings us to Horizon 2.
Tomorrow: Horizon 2
Horizon 2, are projects that can generate somewhat revenue in a relatively short time for the business. With proper investment it may become another cash-cow (Horizon 1) for the company.
It does not necessarily need to happen in-house; a company can be acquired to fill-in the void of Horizon 2 (think of Instagram being acquired by Facebook).
If it is in house, it generally needs an intrapreneur in the company to make the project viable.
Measurement is not in profit, but the potential of profit after investment.
If we go back to the orange tree example. Horizon 2 are already growing trees that are giving oranges. They are not giving plenty, and some are not giving at all, but with proper care (e.g. time and investment) it should be able to replace the old tree (Horizon 1).
After Tomorrow: Horizon 3
Horizon 3, are visionary projects or initiatives with no clear way of making profit.
Projects so far ahead of its time, that it is difficult to grasp how it would actually work in a real-life environment. Let alone a clear way of making profit.
Think of it as when Skynet was first introduced to us in the Terminator franchise during the glorious 80’s. When we were introduced to Skynet, most could not believe something similar happening in the real world. Nowadays, it is less certain.
Nonetheless, not every project or idea should be pursued or invested in. Just enough that it can cover multiple possibilities in the future.
One business development “hack” you can use to assess whether it is worth the investment, is to look at it as an actual investment. Will the rewards it brings beat the local government bonds or fiscal interest rate? If the answer is no, it generally means other options yield better results.
Going back to the orange tree example. Horizon 3 are seeds planted from the fruit of Horizon 1. It is planted way ahead for when it is necessary that it gives oranges. Some can take five years to grow, others can take thirty. The seeds are planted in wildly different places, no-one knows for sure how they will grow or if it will give oranges.
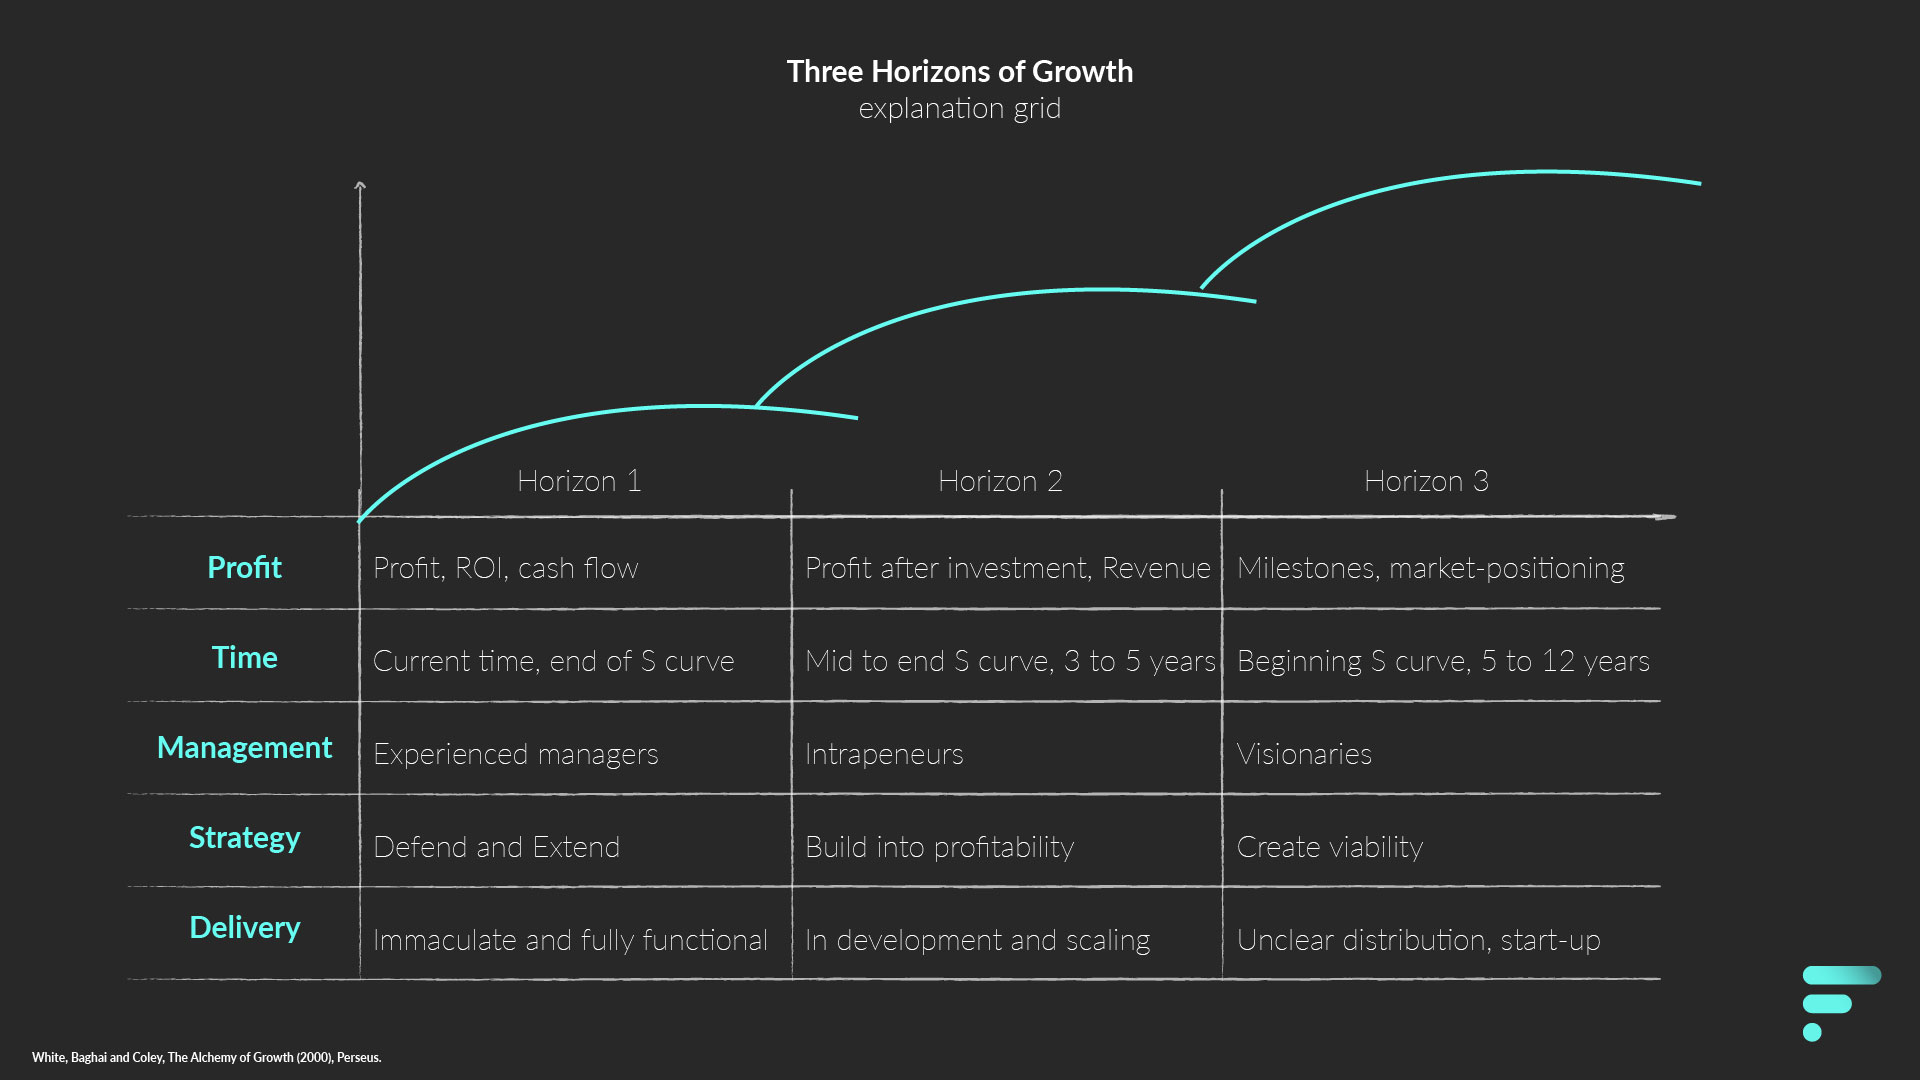
Under you can find an explanation grid of all Horizons.
Clusters and initiatives on the Horizons
As a little background information, which I think is important to understand, is that the authors were working with big companies with multiple product portfolio’s – or at the very least one big cash-cow – and a R&D department. As one may expect when the model is, in part, commissioned by one of the largest consultancy firms in the world.
The authors argue that the model can be used for any company size, I tend to agree with that, with one main exception of how the model clusters different projects to visualize the different portfolios.
Small and medium-sized enterprises generally are not looking too far ahead, let alone investing and managing multiple projects, because the problems in the present are more pressing than problems of the future.
If you recognize that, make sure to spend some time reading Churchill and Lewis Growth Model.
Alternatively, you can also check the 360 model for some inspiration.
Problems with McKinsey’s Three Horizons of Growth
If the critic in you is already spotting some problems of the McKinsey's Three Horizons of Growth, you are not the only one.
The model has not aged well, as the speed in which new products and services are seemingly developed and pushed to market has drastically increased over the years.
Moreover, “profit” or value creation, can be made even without having an actual product to deliver, like crowdfunding has made possible – though it would be more accurate to call it a purchase deed.
In defense of the time issue though, most companies do take a large amount of time to deliver a functional product.
If you have ever been involved in a Kickstarter campaign, either on the buyer end or the manufacturer end, you know, from experience, it always takes longer than you wish.
This is because distribution and product and business development are very time consuming when there are unknown factors or when key infrastructures are not readily available. The previous example does not only apply to public backed projects, but also other companies funded by equity investors: think of Airbnb, Uber, Tesla etc.
Moreover, profit as a measurement axis, is not necessarily a 1:1 indicator for growth. Although it is a very important KPI, and for some the most important KPI, it is not always the best KPI to measure growth.
To grow you need investment and investment trumps profit. Which is why there are so many high-profile companies operating at a loss, but still growing – though, there are valid arguments to call it a Horizon 2 project.
Nevertheless, using profits from Horizon 1 to fund other Horizons, leads, understandably, to lower profit for the company. Thus, the model is influenced by its own axes.
Lastly, in defense of both axis, one can stretch or contract both, depending on the customary product life cycle. For example, creating a burger with available ingredients is, timewise, a lot faster than producing a rocket-ship. In addition, a burger can bore more quickly than a rocket-ship (life cycle).
Tesla and the Three Horizons of Growth
A portfolio management example
Elon Musk, Co-Founder of Tesla Inc., has shared two master plans with us, part 1 published in 2006 and part 2 ten years later.
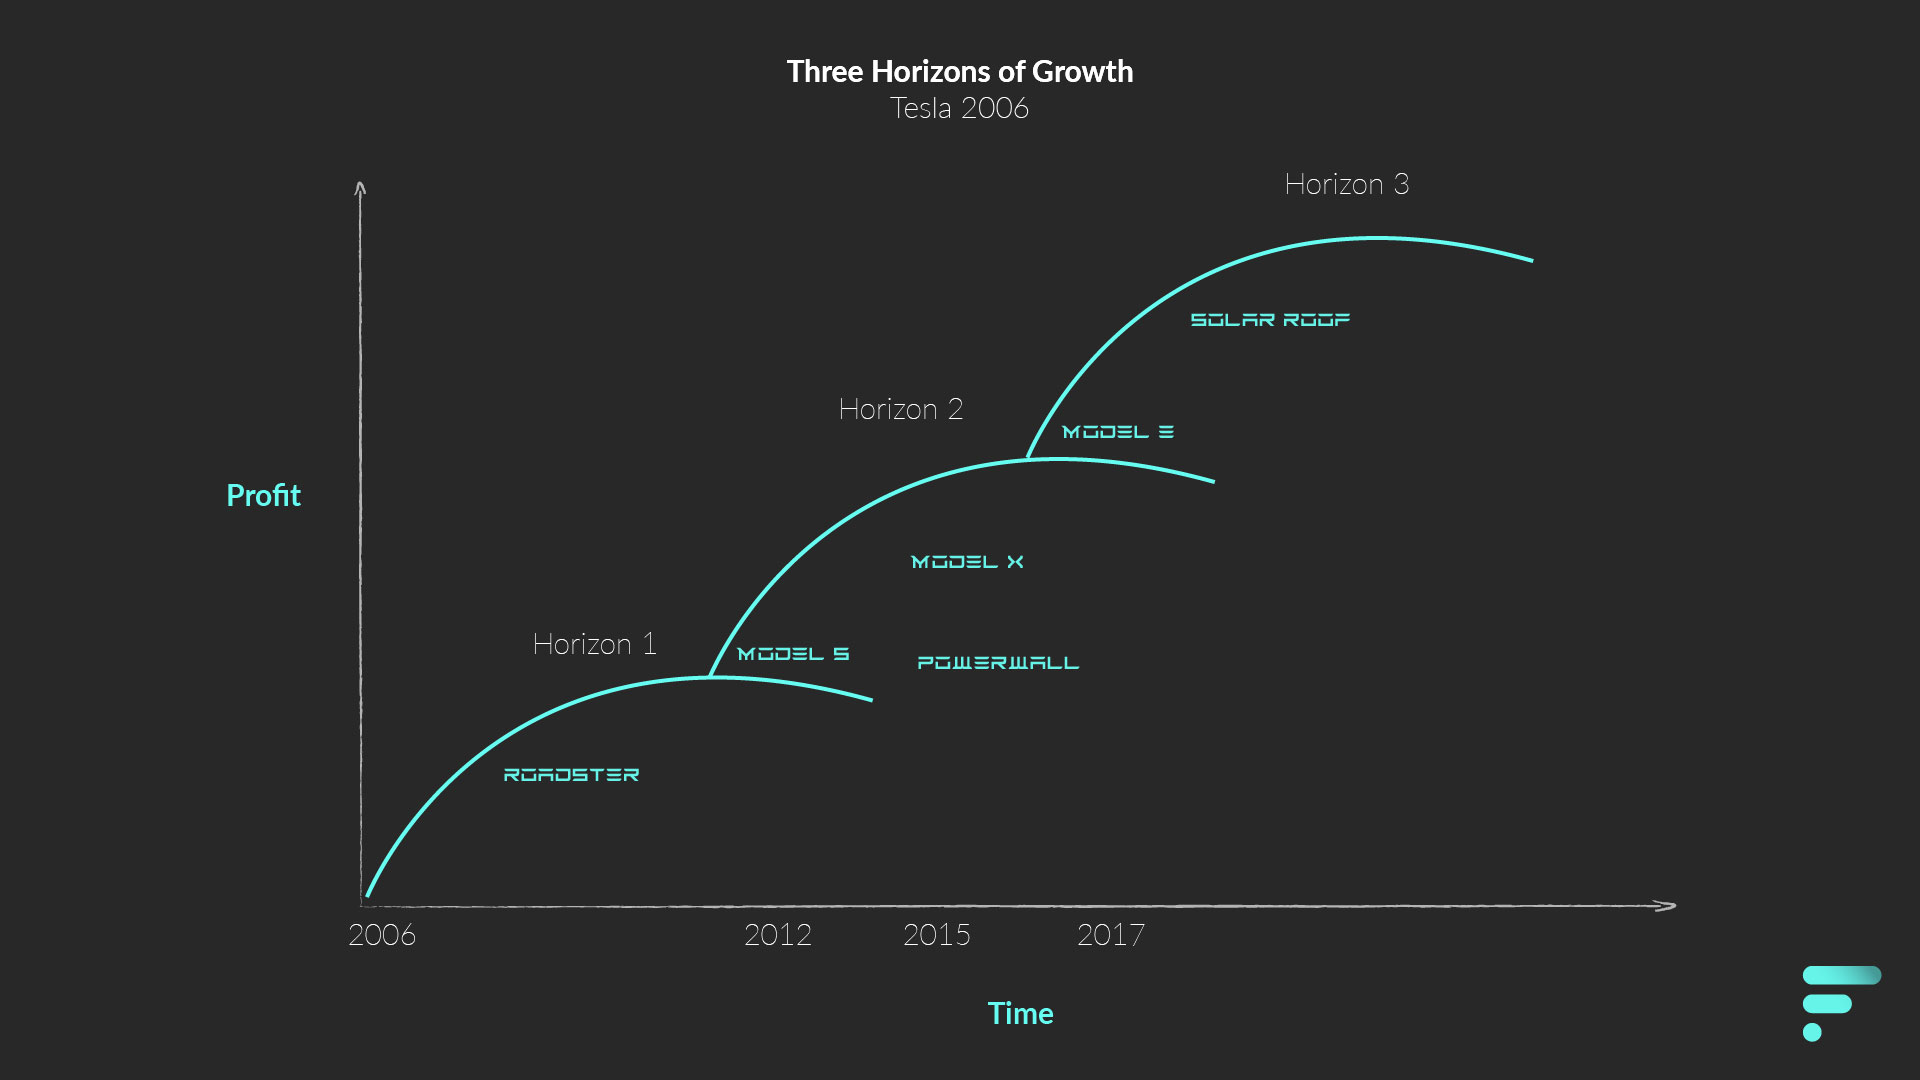
Tesla’s first plan, was to create a low volume expensive sportscar (Roadster), use the money made with the sportscar to build a medium volume more affordable car (Model S/ Model X), then use that money to build a high volume affordable car (Model 3). While building the above, also provide zero emission electric power generation (Solar roof/Solar City, Powerwall, etc.).
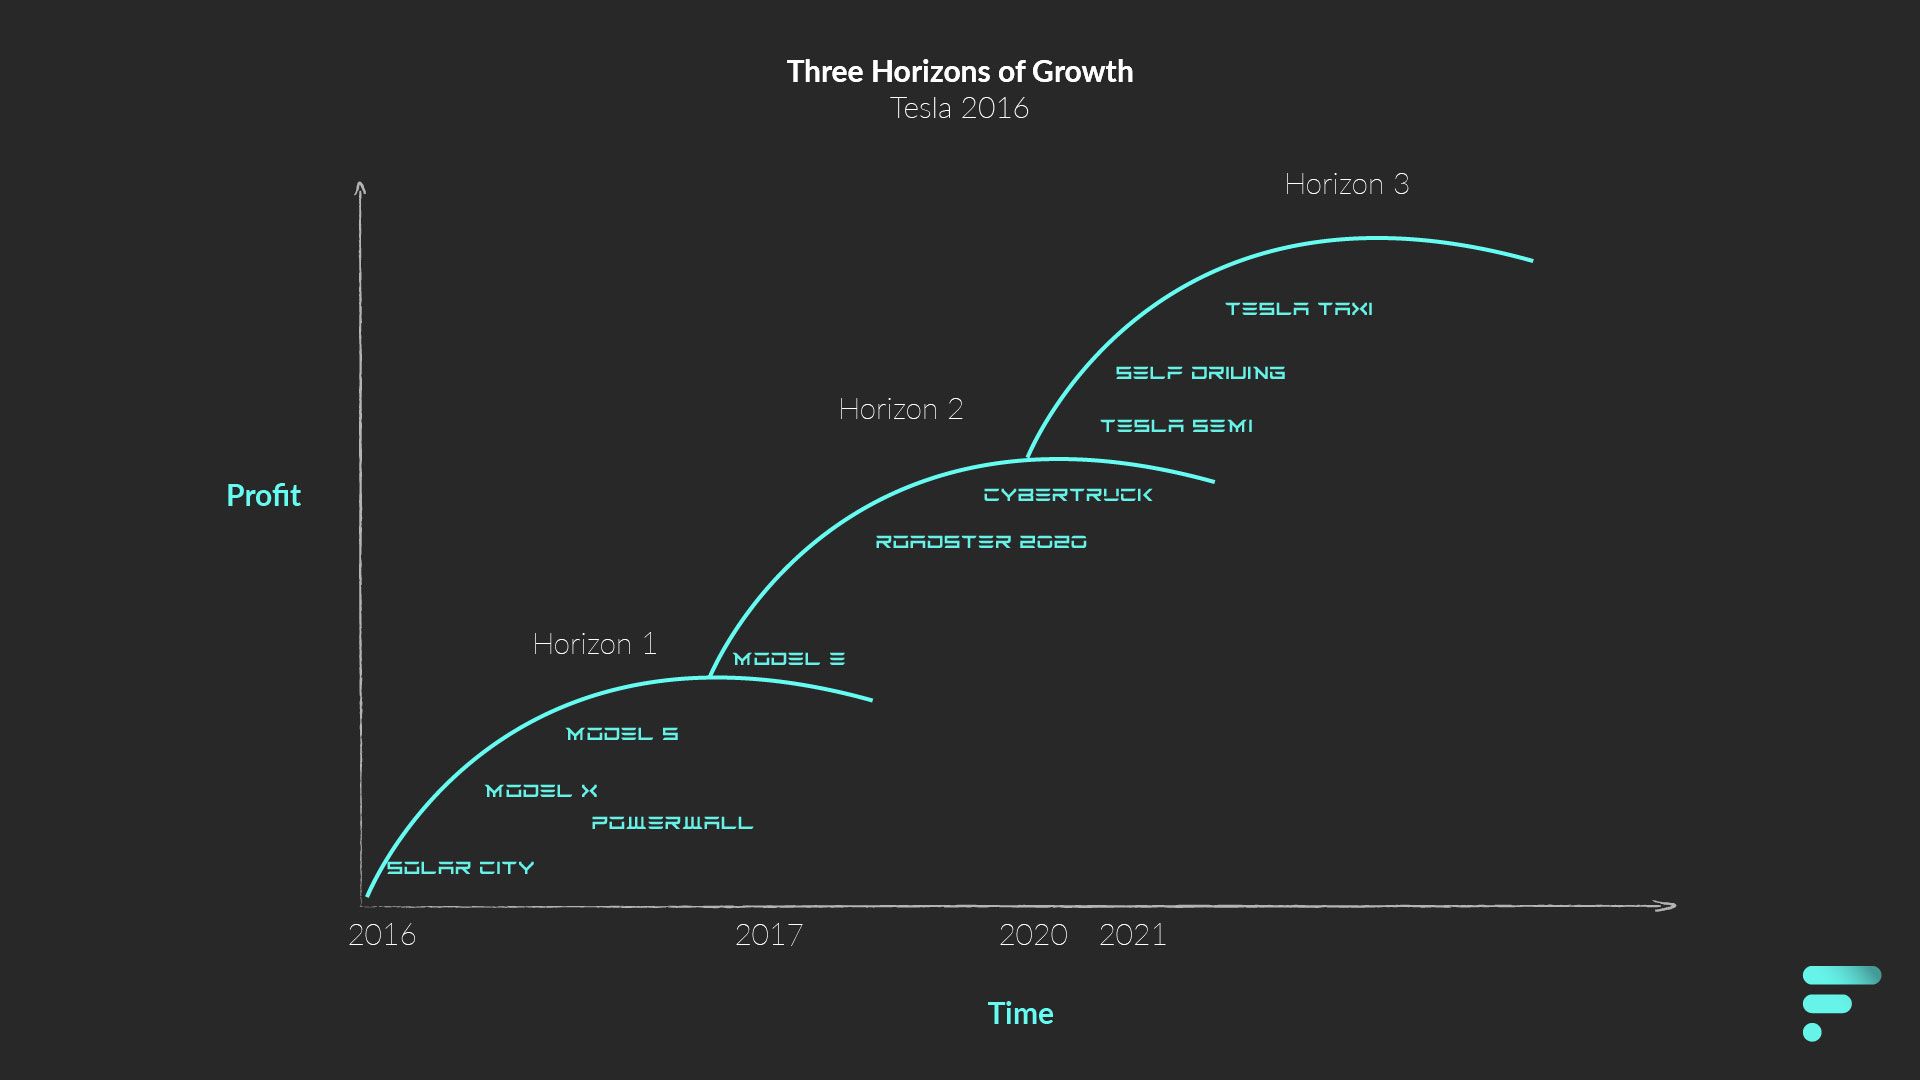
In part two, it is more concrete that building solar roofs and energy storage takes a priority (acquisition of SolarCity), expand the electric car fleet to different segments (Cybertruck and Tesla Semi), expand the self-driving capability and lastly for the owners to make money of their cars when not in use – the last part will be debatable once they start launching, inevitably, a self-driving taxi fleet.
Without getting into details on the why’s, how’s, what’s of the business plan (Elon Musk does address some of the questions), let’s use McKinsey's Three Horizons of Growth model as an example.
We will merge the two master plans, as it covers over a decennium of development.
In 2006, the Three Horizons of Growth, should have looked something similar like this:
Although above examples showcase the plan and the road to growth, with the information now available, we can look at it differently.
We can look deeper into Tesla with the model with available data, so we can understand how the theory works out in practice.
Tesla, beyond the three horizons
As a disclosure, I will not go in detail through the SEC Filings (i.e. year/quarter reports) and will use quick calculations to move forward with the exercise. Also, I will purposefully leave some aspects of the model out (think of leadership needed in the different Horizons), as it is beyond the scope of showing the model in practice (its axes).
Moreover, keep in mind that in the earlier years Tesla was a private company, which means that information pertaining to financials is fragmented and lacks transparency.
Additionally, when Elon Musk is talking about “money” on the masterplan, “money” means much more than just cash. What Elon Musk likely meant to write was that using everything pertaining to value for subsequent products: technology, positioning, know-how, brand, staff, investors, etc. That value is not captured by the model, which is the biggest drawback of the model in my opinion (and why I do not tend to use the model as is).
Moreover, as Dr. Alan N. Hoffman has explored in a case published on the 15th edition of Strategic Management and Business Policy, Tesla Motors generated revenue from other sources than just the Roadsters. By participating in federal programs, selling Zero-Emission Vehicle Credits, licensing its patents and, later, leasing. Revenue that, at least at the beginning of the venture, are thought of exceeding the revenue generated from cars like the Roadster at the beginning.
The above findings seem to echo with the press release on its first profit in July 2009 and the 2010’s 10-K form. Where the revenue generated and sold cars do not match. This is important to know, as it signifies that disclosed total revenue numbers are not accurate for an exact estimation. However, for this exercise, we will use revenue figures, in some cases, to come to a rough estimation.
Lastly, Tesla Inc. has yet to make a yearly profit, which would, theoretically, void the model. But we will look into it in gross-margin on units sold from available information. Which, again, is a rough estimation.
Roadster: Horizon 1
Let us rewind back to when the first master plan was introduced: 2006.
Back then, Tesla Motors was developing a few prototypes before entering production at the beginning of 2008. The prototypes eventually lead to a manufacturing the Roadster.
The ideation of the Roadster was to be a limited-edition car but at a high-end selling price. In the master plan Musk mentions a price point of US$89,000. Which later, at the end of the summer of 2007, was changed to a starting price of US$109,000.
An internal audit at that point, allegedly, showed that the production costs – for materials only – would be US$140,000. In the middle of 2009 it was reported that Tesla was able to reduce the production costs to about US$80,000. That would put it at a margin of at least 26% (which does not match with the 21% on the 2010’s 10-K form, but can be possible).
That the cost-price of “Horizon 1” exceeded (mostly) the selling price, makes the Horizon in the model skewed.
Now that we know, more or less, what the gross-profit per unit is, we need to look into shipped units. Which is more known and have placed in the table under.
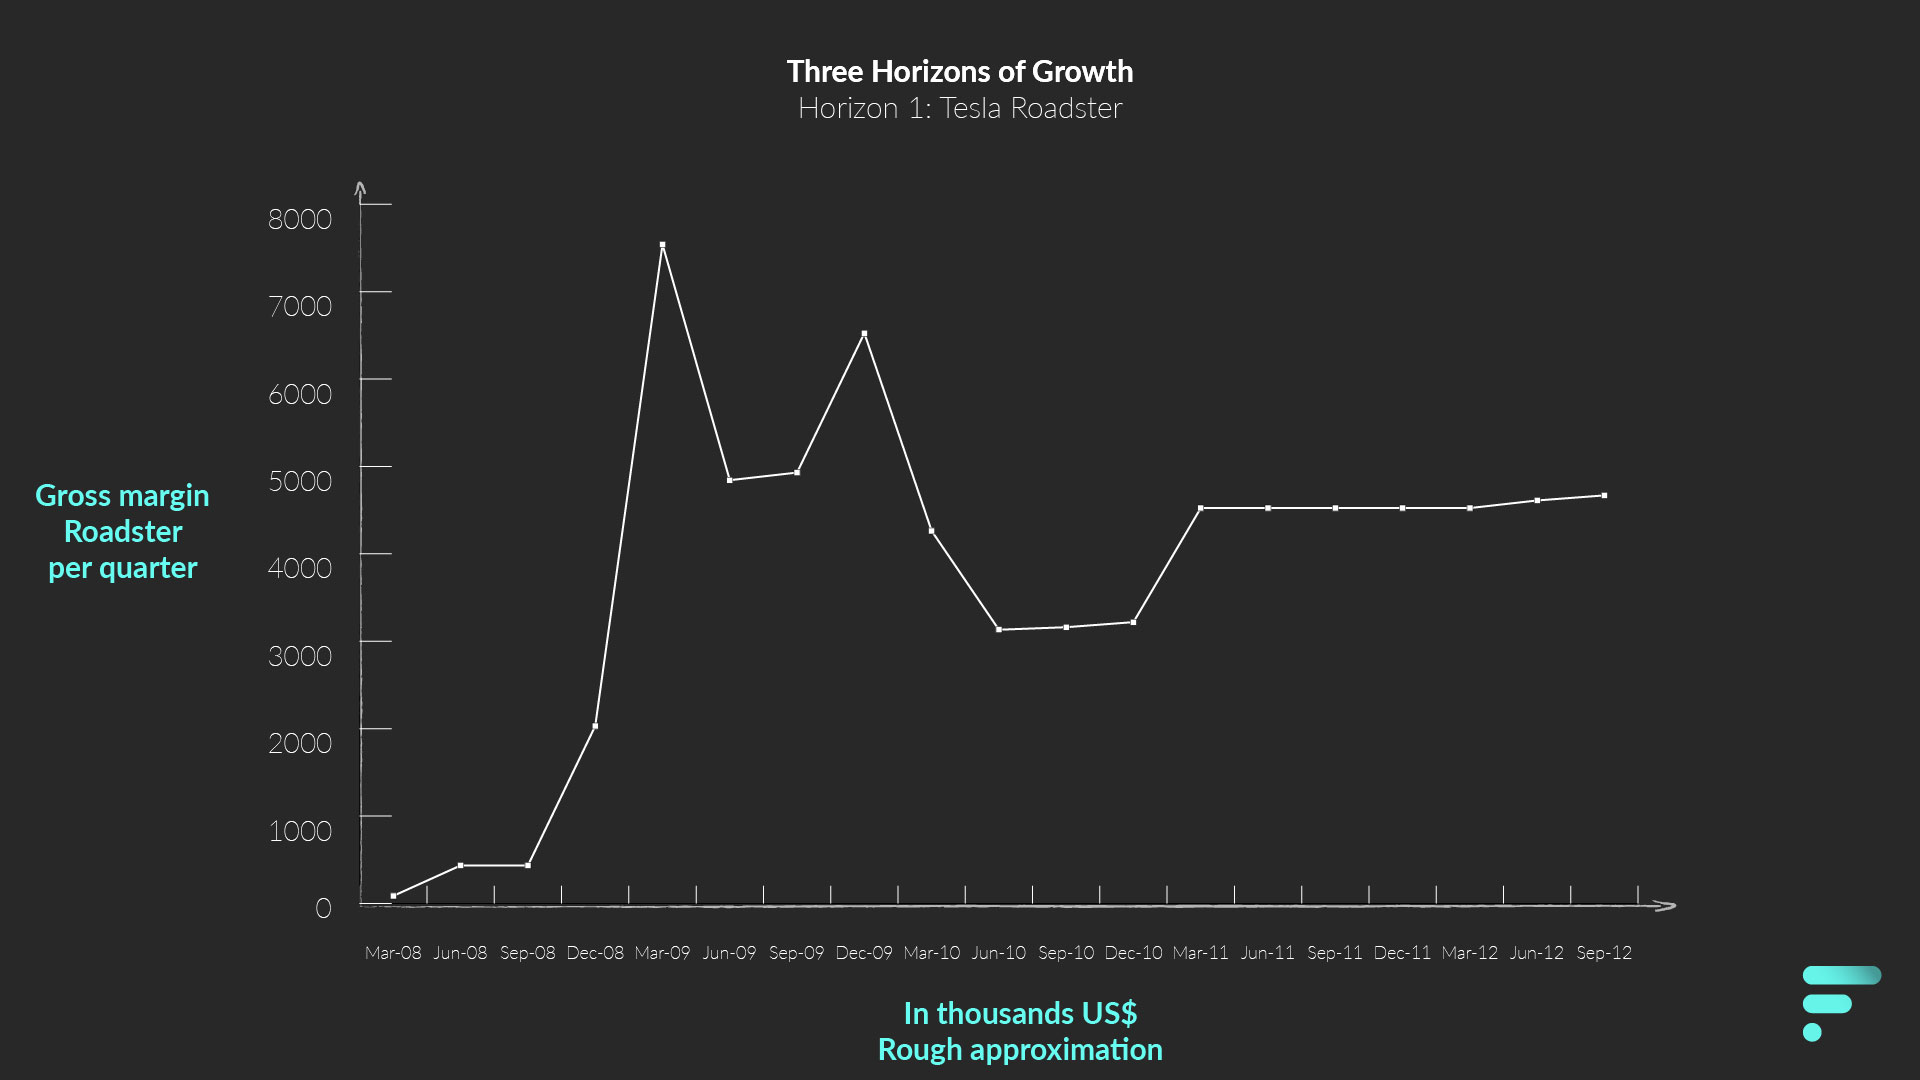
The profit generated in Horizon 1, would have flowed to other projects. Even though it did not work necessarily that way, as the Roadster had, from a profit point of view, nearly no effect on the development of Horizon 2 and Horizon 3.
With other types of value though, it was a different thing.
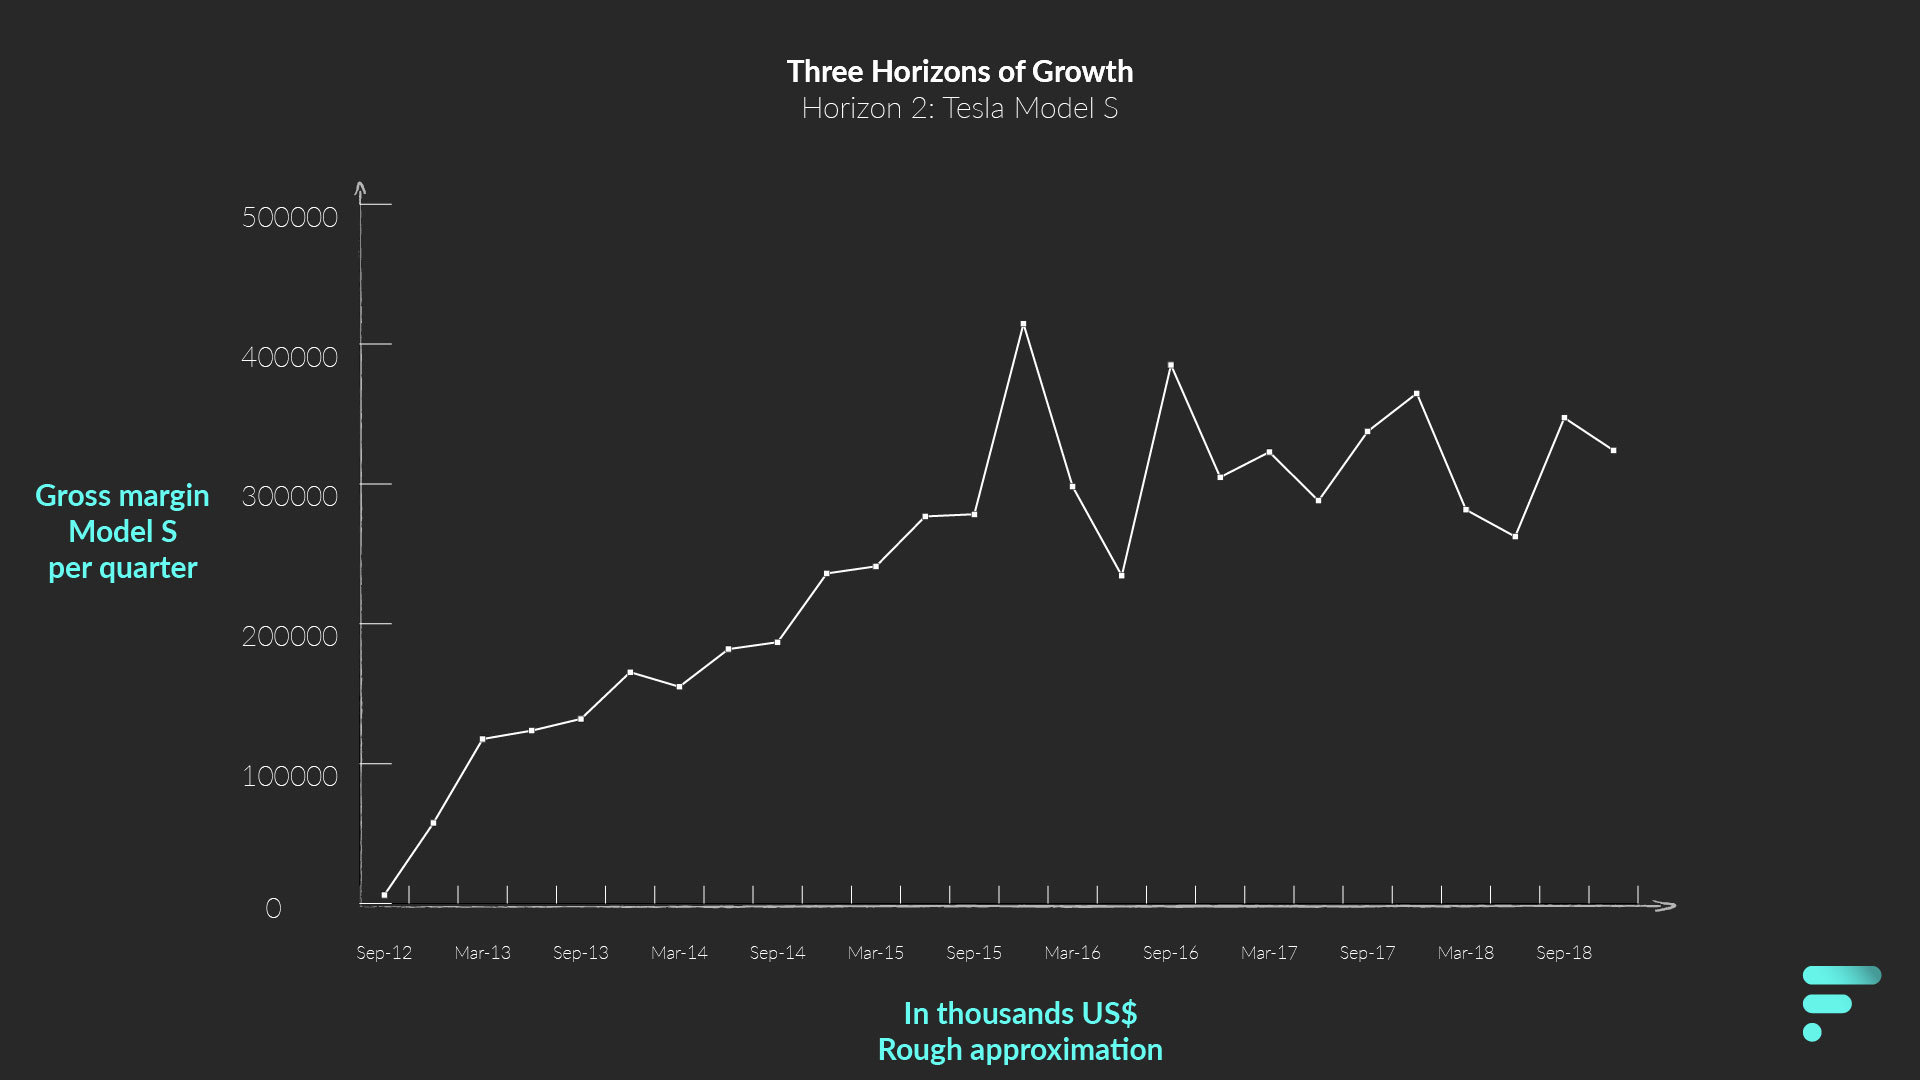
Model S: Horizon 2
At the beginning of 2012 Tesla ceased the production of Roadsters, as the contract with Lotus to provide gliders expired.
The second car, Model S, was targeted to mid-high income. Had a price between US$79,000 and US$119,000 and delivery started shortly before the Roadster was discontinued.
During 2012, Model S would take over the position of the Roadster as a Horizon 1 venture. Many aspects from the Roadster were recycled to make the car more affordable. Economies of scale had a big impact on the affordability.
Tesla targets a manufacturing gross margin of 25% on vehicles. For the Model S, we know from 10-K reports that the gross margin swivels between 22% and 27%. A quick calculation on 2014’s 10-K, we can see that the average price of the Model S, is lower than $US99,000. A survey conducted by Bloomberg, seems to confirm that, and highlight that the average selling price was US$95,000.
With the information above, and information about shipped vehicles, we can make a new table for Horizon 2.
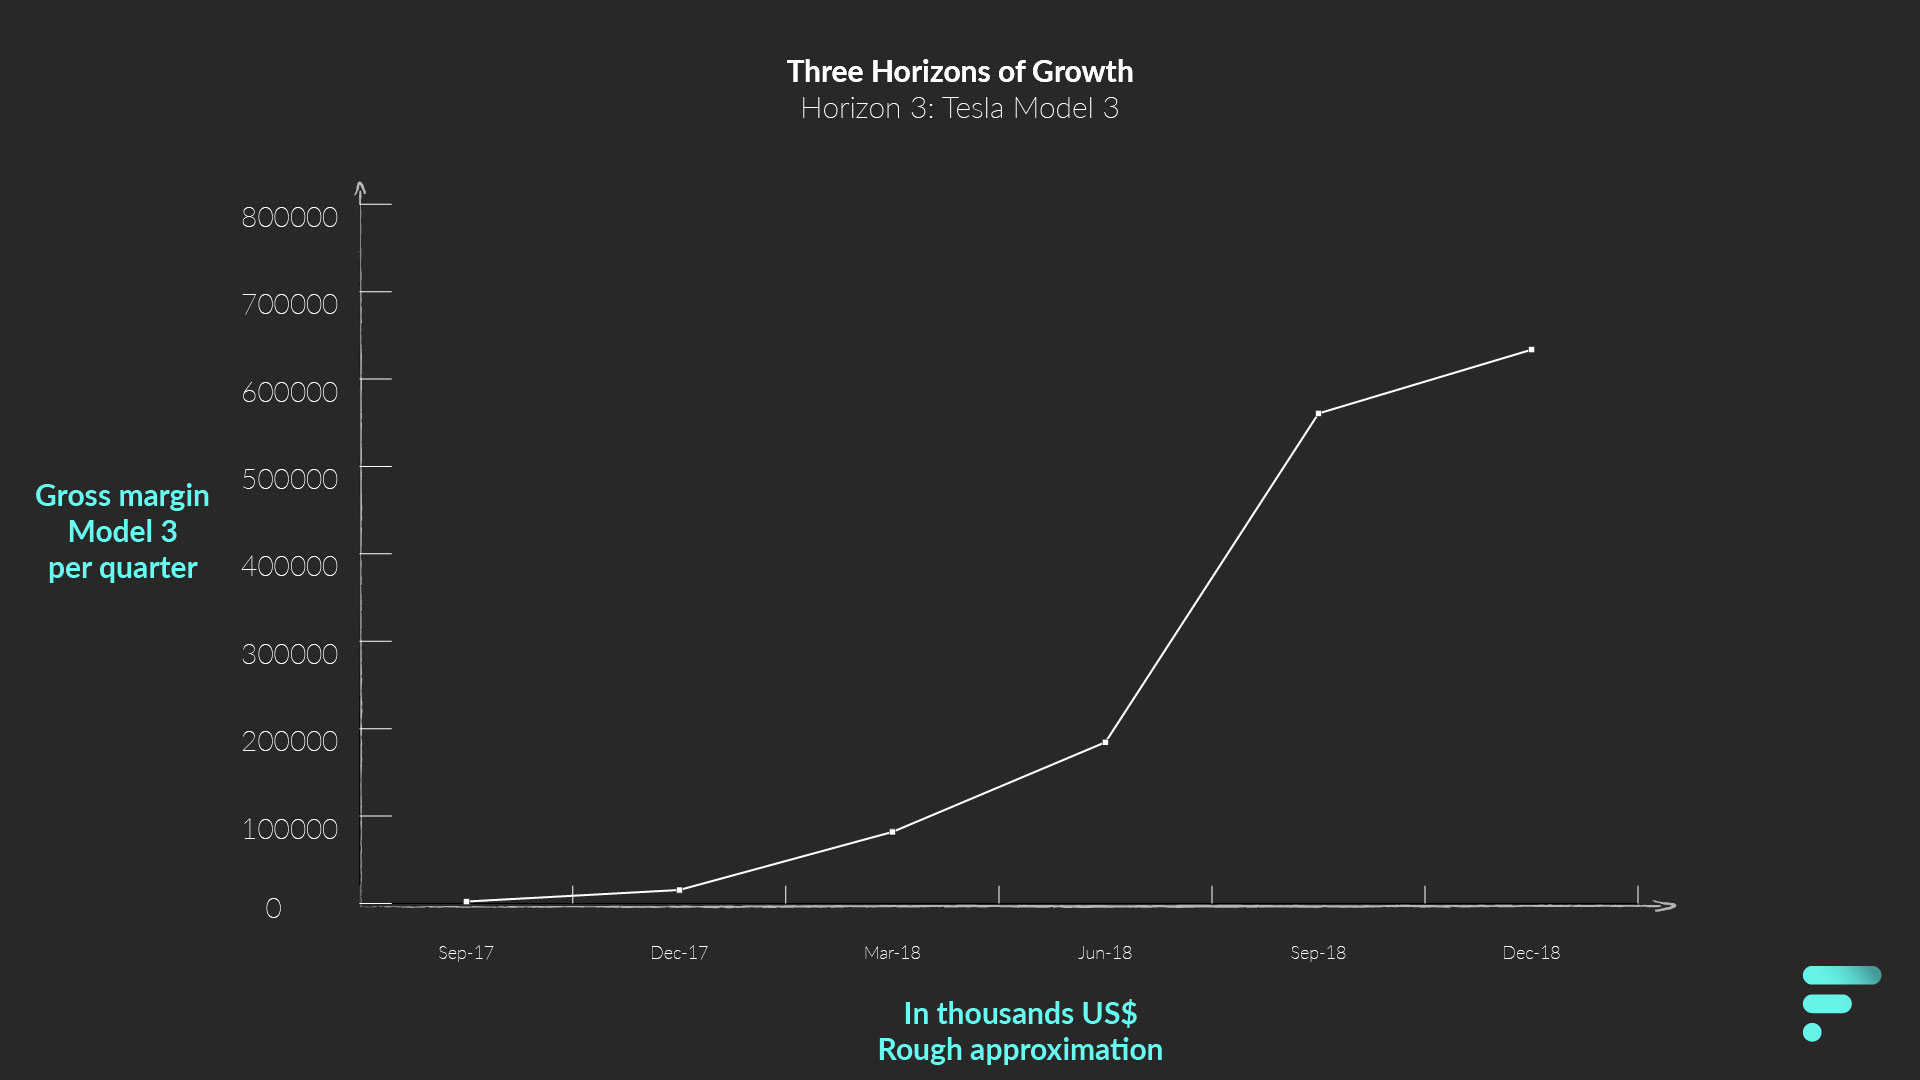
Model 3: Horizon 3
From 2012 to 2017, the Model S was experiencing exponential growth. So was Model X, but we have left that out of the table. In the third quarter of 2017, Tesla started delivering the Model 3.
The Model 3 was the vehicle meant for a wider audience. At a price range between US$35,000 and US$59,500. We know that at least the gross margin for Model 3 is much lower than 20%.
At this stage, we are not able to calculate accurately the average selling price of the Model 3. A quick calculation shows that for 2018 Q4, it was below US$61,000 which is higher than the highest retail price. As it was before, a survey conducted by Bloomberg, highlight that the average selling price was US$50,500.
With the information above, and information about shipped vehicles, we can make a new table for Horizon 3.
Combining the Horizons
We have looked at three vehicles that are correspondent to three different time periods of Tesla.
Joining all the previous tables, gives us a new table.
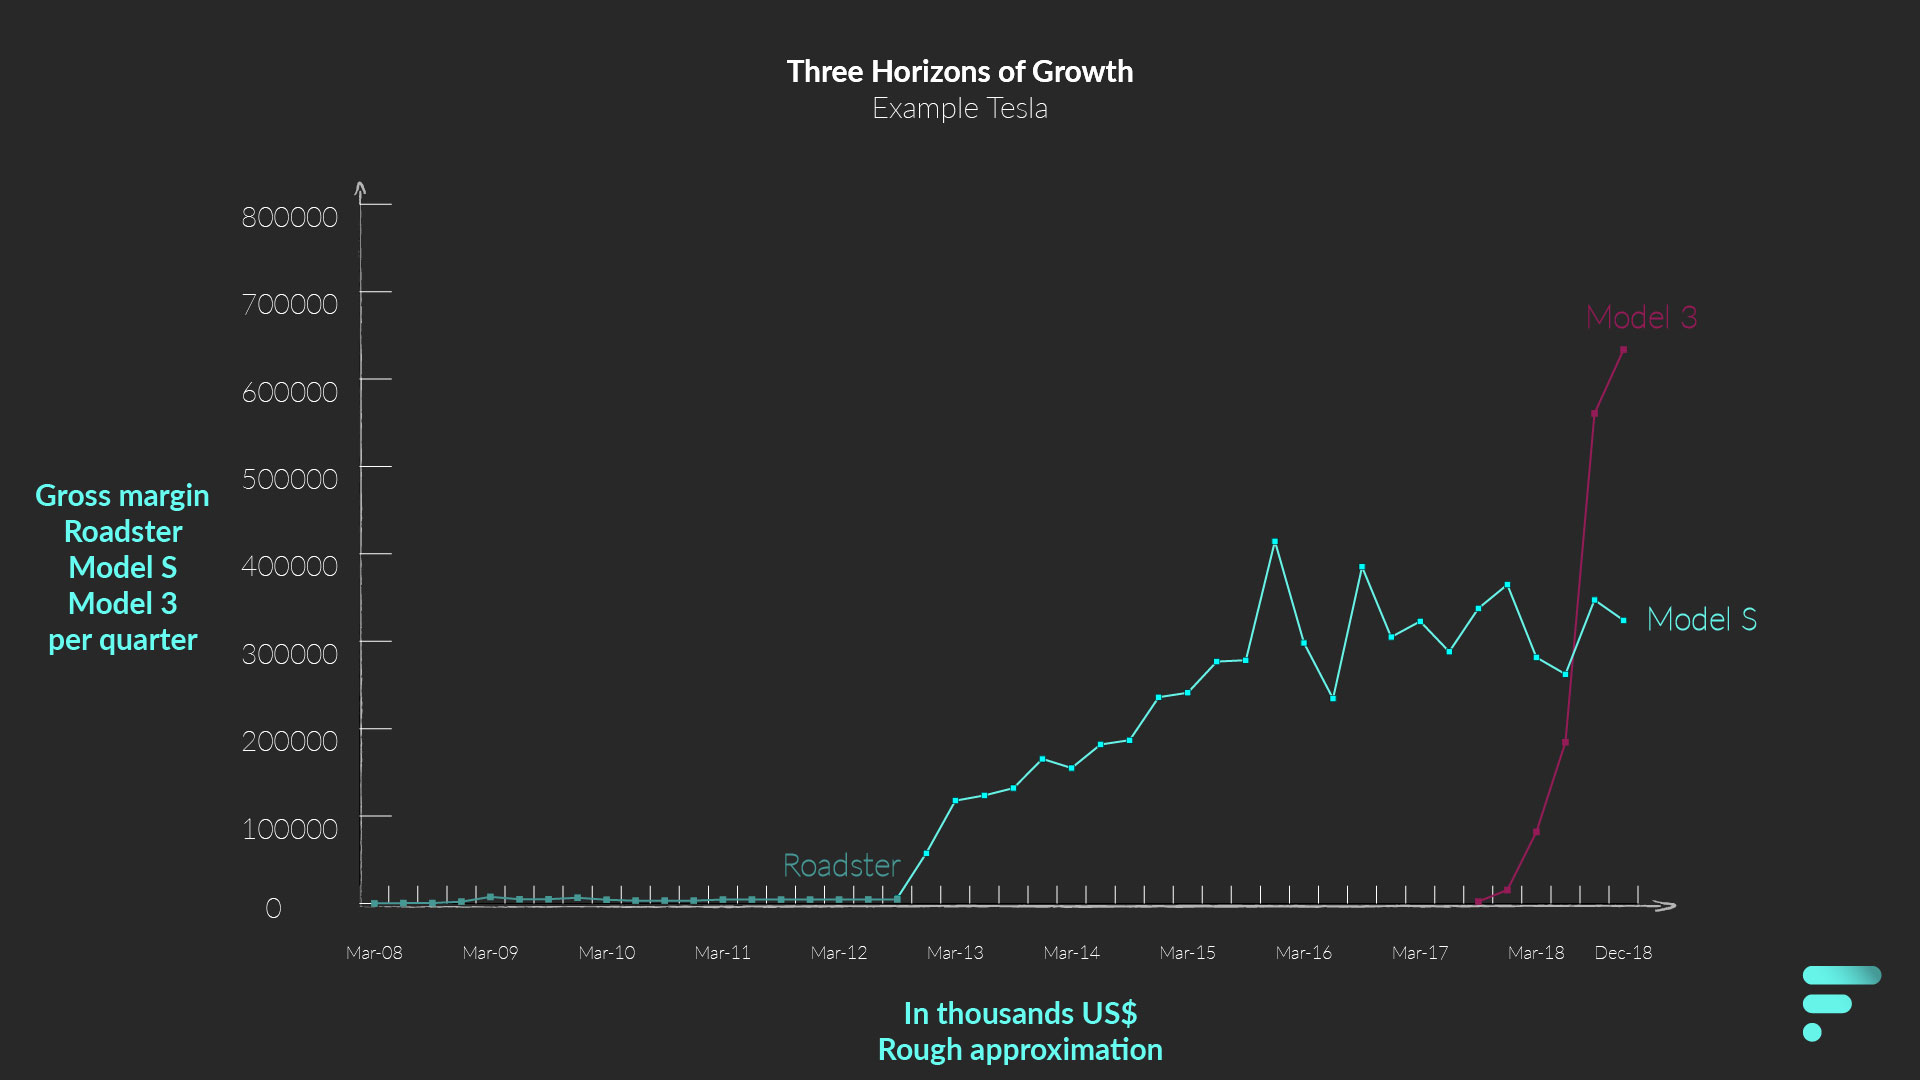
A quick take away from the table above, is that it does fit with three horizons model. The Roadster (Horizon 1), jumpstarted the business and had a definitive life cycle.
The Model S (Horizon 2), quickly took the position of Horizon 1 and seems to have had a larger impact on the development of the next Horizon. Horizon 2 seems to still be relatively stable up-until the end of 2018.
Model 3 (Horizon 3), took off from the start. Although, we cannot see it from the table, we know from the text accompanying it, that the margin and average price was lower than its predecessor. Telling us that the volume of sales, fits the plan plotted by Elon Musk. The performance of the Model 3, can make us think it will be becoming more quickly a Horizon 1 initiative.
However, there are a lot of things that we cannot read from the table. Some of it is because we have left other initiatives out of the table (Model X, Powerwall, Solar City, etc.). Others, because, well, the model is not able to show.
What the model shows, is what Tesla’s offering brings to the finance table. What a specific product brings in for the company. What the model does not show, is the process of value generation and how that can help in making long-lasting decisions.
Which, as a portfoliomanagement tool for future projects, is a must.
For that, though, you need a different model.

Share this Page